
Raw exposure seconds treat a sharp centre-frame brand the same as a blurred mark in the corner. Sponsorlytix applied attention and saliency models so media value reflects where viewers look and how clearly brands appear.
Eagle Eye combined classic saliency predictors with sport-aware overlays that respect ball, athlete, and graphic attention magnets. Quality-weighted indices sit on top of Brand Detection and Placement Detection using the standard analytics factors — position, time, clarity, visibility, size, viewership.
Problem framing for rights holders and brands
Commercial teams price inventory on quality as well as quantity. A courtside LED behind the ball differs from one buried under a lower-third graphic. Pure area-time metrics miss that gap and flatten rate-card negotiations into second counts nobody trusts.
Rights holders want raw dwell for legacy comparability and quality-weighted indices for modern pricing. Brands want both — and an explanation of why a jersey mark in a post-up close-up outranks a distant ribbon.
- Saliency maps estimate gaze likelihood per frame under broadcast composition.
- Ball, athlete, and replay-bug detectors mark attention competitors.
- Clarity, contrast, and occlusion multiply with saliency overlap.
- Rate cards optional: indices remain useful when partners price themselves.
Methodology — saliency, competitors, quality fusion
Saliency maps estimate gaze likelihood per frame. Sport object detectors mark ball, athletes, and replay bugs that compete for attention. Brand regions receive a quality score from saliency overlap, sharpness, contrast, and occlusion. Media value aggregates quality-weighted exposure using partner rate cards when provided.
Without rate cards, Sponsorlytix reports quality-weighted exposure indices partners can price themselves. VLM judges optionally critique whether a region was actually readable in context. HITL samples extreme re-rankings before they hit partner PDFs. Results appear beside raw dwell in Koba.
Viewership, when available from partner feeds, scales the quality index without replacing clarity or saliency. A huge audience on an unreadable mark still does not become premium inventory in the Sponsorlytix ledger.
Detection panels — regions that saliency re-ranks
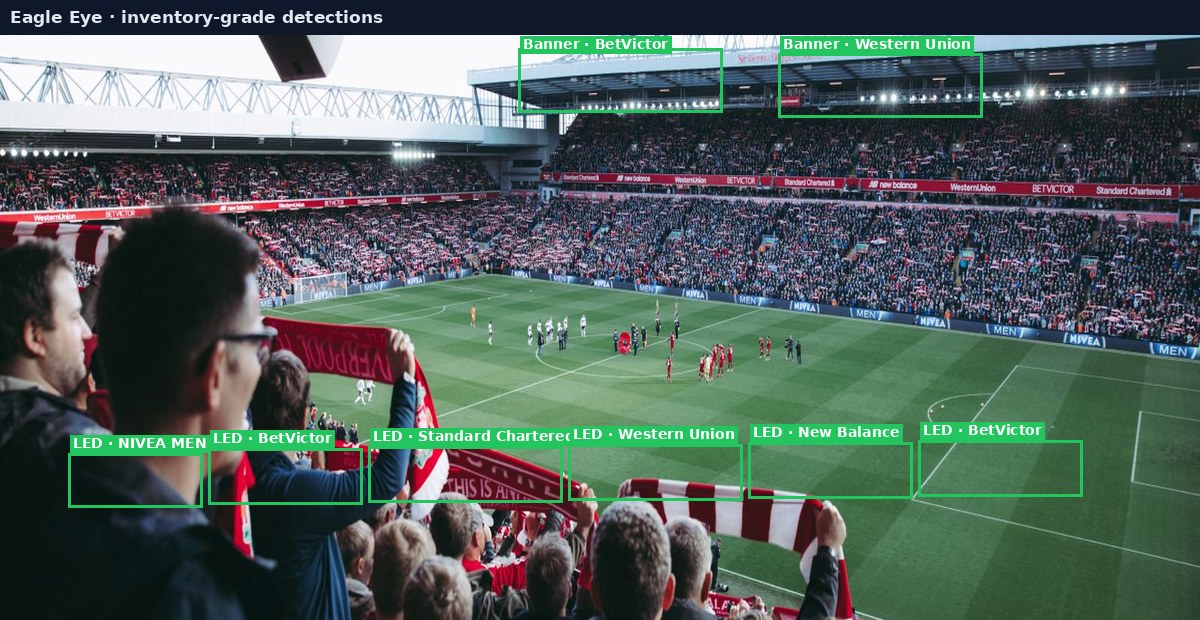
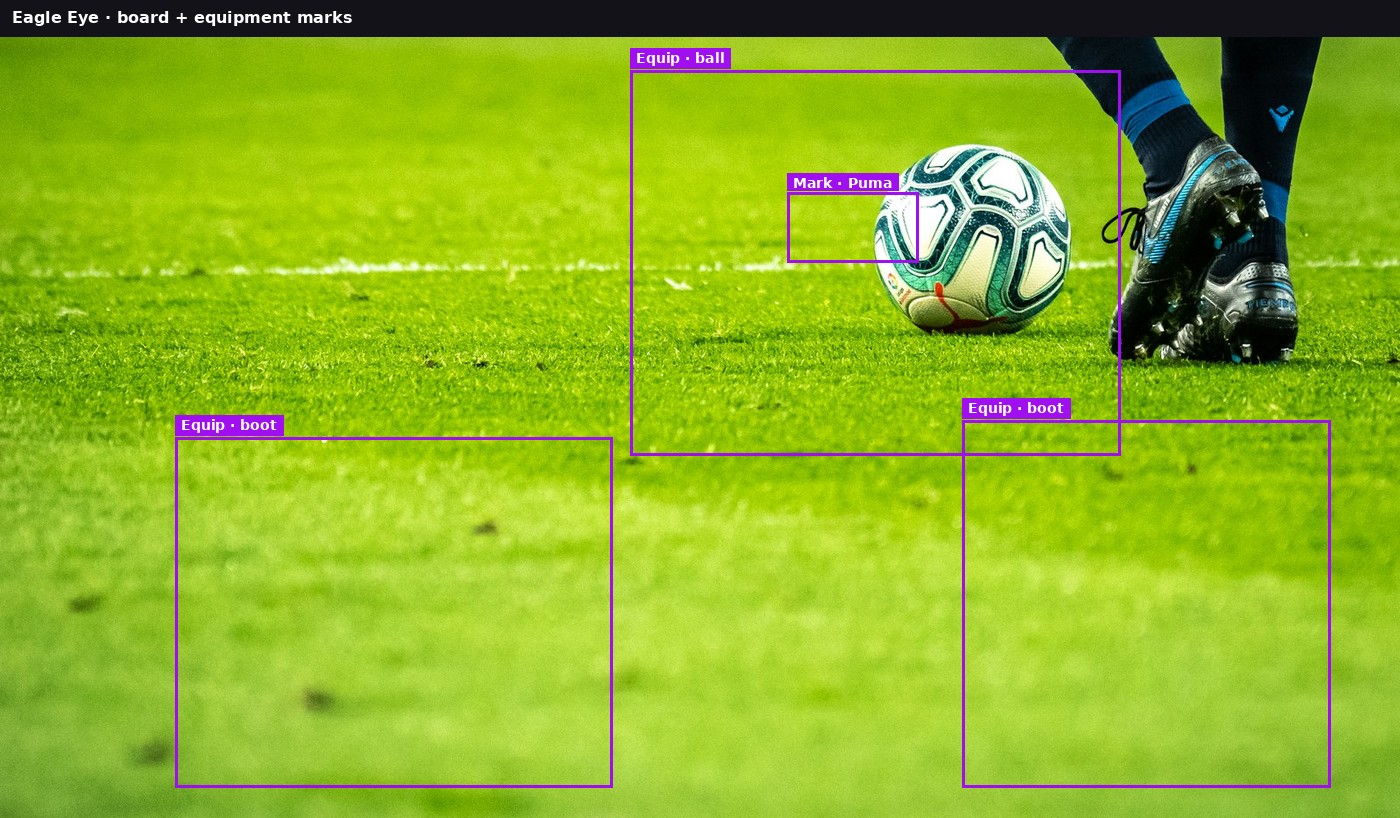
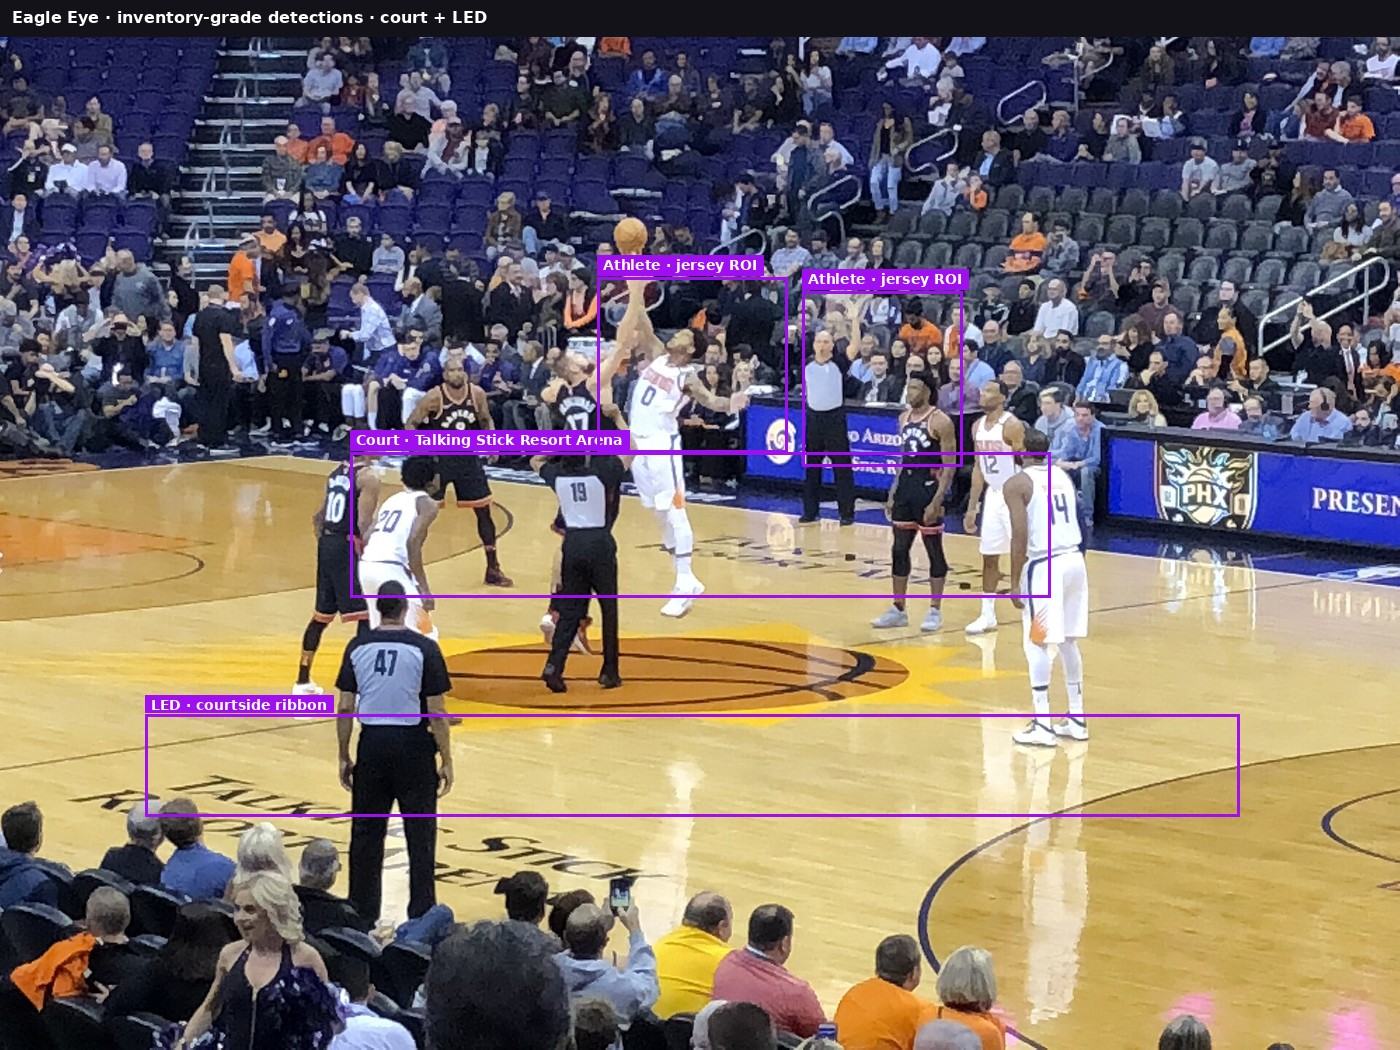
Real-world quality-weighting examples
- Football LED ribbons near the ball versus far-side ribbons during build-up.
- Tennis court logos during rallies versus backdrop walls under lower-thirds.
- Basketball jersey marks in post-up close-ups versus distant courtside strips.
- Combat mat logos during ground exchanges with high athlete occlusion.
- Motorsport onboard livery in focus versus compressed distant gantry boards.
Results discussion (illustrative)
Quality weighting often lifts close, sharp athlete-adjacent marks and lowers distant or occluded inventory. Sponsorlytix presents raw and weighted views side by side so commercial teams choose the language their partners expect. No fabricated company scores — charts stay labelled illustrative.
Code — quality-weighted exposure
def quality_weighted_exposure(brand_region, saliency, clarity, occlusion, competitors):
    attention = mean(saliency.crop(brand_region))
    # Down-weight when ball/athlete/graphics dominate the same foveal region
    competition = competitors.overlap(brand_region)
    quality = attention * clarity * (1.0 - occlusion) * (1.0 - 0.5 * competition)
    return brand_region.dwell_sec * quality

def media_value(exposures, rate_card=None):
    idx = sum(e.quality_weighted for e in exposures)
    if rate_card is None:
        return {"quality_index": idx}
    return {"quality_index": idx, "currency": rate_card.price(idx)}
type QualityFactors = {
position: number;
time: number;
clarity: number;
visibility: number;
size: number;
viewership?: number;
saliency: number;
};
function qualityIndex(f: QualityFactors): number {
const base = f.position * f.clarity * f.visibility * f.size * f.time * f.saliency;
return f.viewership != null ? base * f.viewership : base;
}Takeaways
Saliency-aware scoring turns sponsorship measurement into quality-weighted media value. Sponsorlytix delivers that layer on top of Eagle Eye detection so brands see not only whether they appeared, but how strongly they appeared on screen.
Raw seconds remain available. Quality-weighted indices sit beside them for commercial decisioning — with HITL guarding extreme re-rankings.