
Football broadcasts pack brand inventory into LED ribbons, digital boards, tunnel wraps, and temporary overlays that shift with every camera cut, replay package, and lighting change. Sponsorlytix Brand Detection and Placement Detection treat every visible mark as a measurable exposure event — not a static logo checklist pasted onto a match summary.
Eagle Eye models operate on the same broadcast feeds rights holders already produce. The stack segments pitch-side surfaces, tracks brand instances across frames, scores visibility under motion and occlusion, and writes exposure records that reconcile against contracted inventory for leagues, clubs, and brand partners. Analytics factors — position, time, clarity, visibility, size, and viewership — sit on every event so commercial teams price what audiences actually saw.
Problem framing for rights holders and brands
Rights holders sell inventory by asset class and package: primary-camera LED ribbon during open play, behind-goal digital boards on goal-line cuts, tunnel branding in half-time packages. Brands buy those promises. Without continuous computer vision, fulfilment collapses into sample clips and operator memory.
Manual clip logging cannot keep pace with multi-camera Premier League or World Cup coverage. LED panels cycle creatives every few seconds. Corner flags, substitution boards, and technical-area wraps add inventory that vanishes between angles. FIFA World Cup–scale multi-venue workloads demand the same discipline at global throughput.
- Contract language names packages; detectors must map those packages to asset classes and camera roles.
- Creative rotation means the same physical LED segment carries different brands within one half.
- Occlusion from players, officials, and broadcast graphics must down-weight — not invent — exposure.
- Partners need one ledger shared by commercial, ops, and brand reporting teams.
Methodology — hybrid CV, embeddings, and HITL
The pipeline starts with broadcast ingest and frame-level camera metadata when available. A sports-scene segmenter isolates pitch-side LED ribbons and digital boards from crowd and pitch texture. Brand detectors propose tight bounding regions on those surfaces — inventory-grade boxes, not loose player silhouettes that merely contain a logo somewhere inside.
Temporal association links detections into tracks so a brand that survives a camera pan remains one exposure object. Logo embedding heads and OCR assign brand identity against the Sponsorlytix ontology. A visibility scorer weighs on-screen area, sharpness, and occlusion before the event lands in the measurement store. Ambiguous creatives escalate to human-in-the-loop review; operators confirm brand and asset class without rewriting the detector.
Where classic detectors struggle on novel mid-season creatives, a vision-language pass resolves identity into the same ontology. Turtul — Eagle Eye's coming VLM / LLM Vision surface — extends that escalation path. Koba remains the dashboard surface inside Eagle Eye where ops and commercial teams inspect tracks, exceptions, and fulfilment.
Detection panels — inventory-grade boxes on real frames
The panels below are methodology illustrations on real stadium stills: tight boxes on LED segments and boards, labelled by asset class and brand. They are not live product screenshots and do not claim published mAP scores.
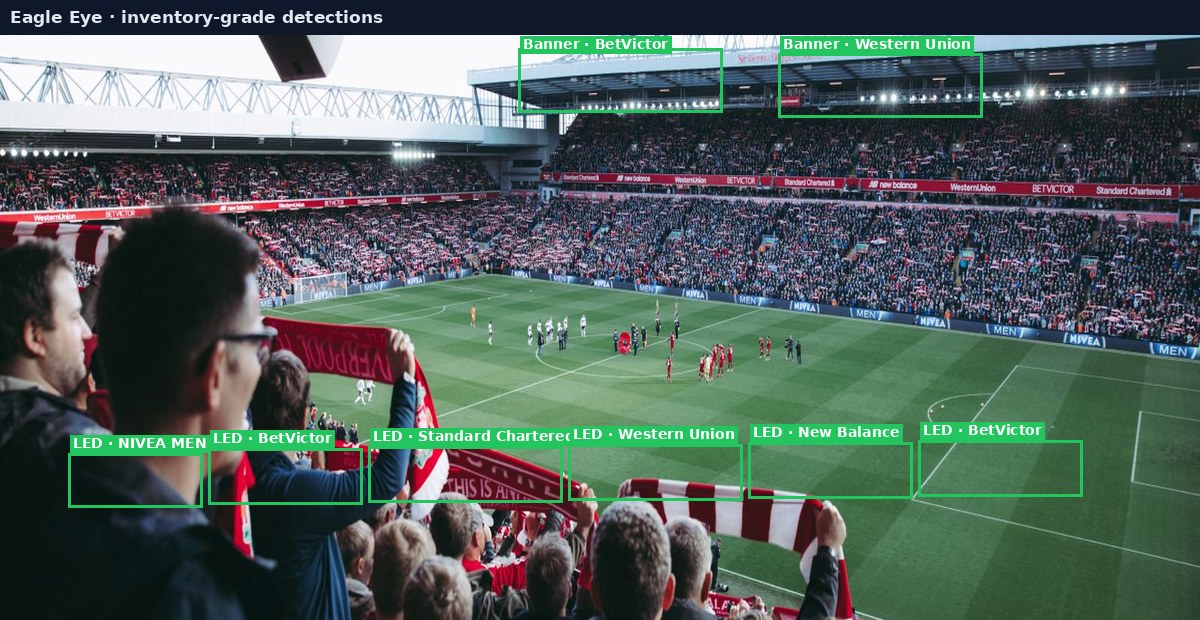
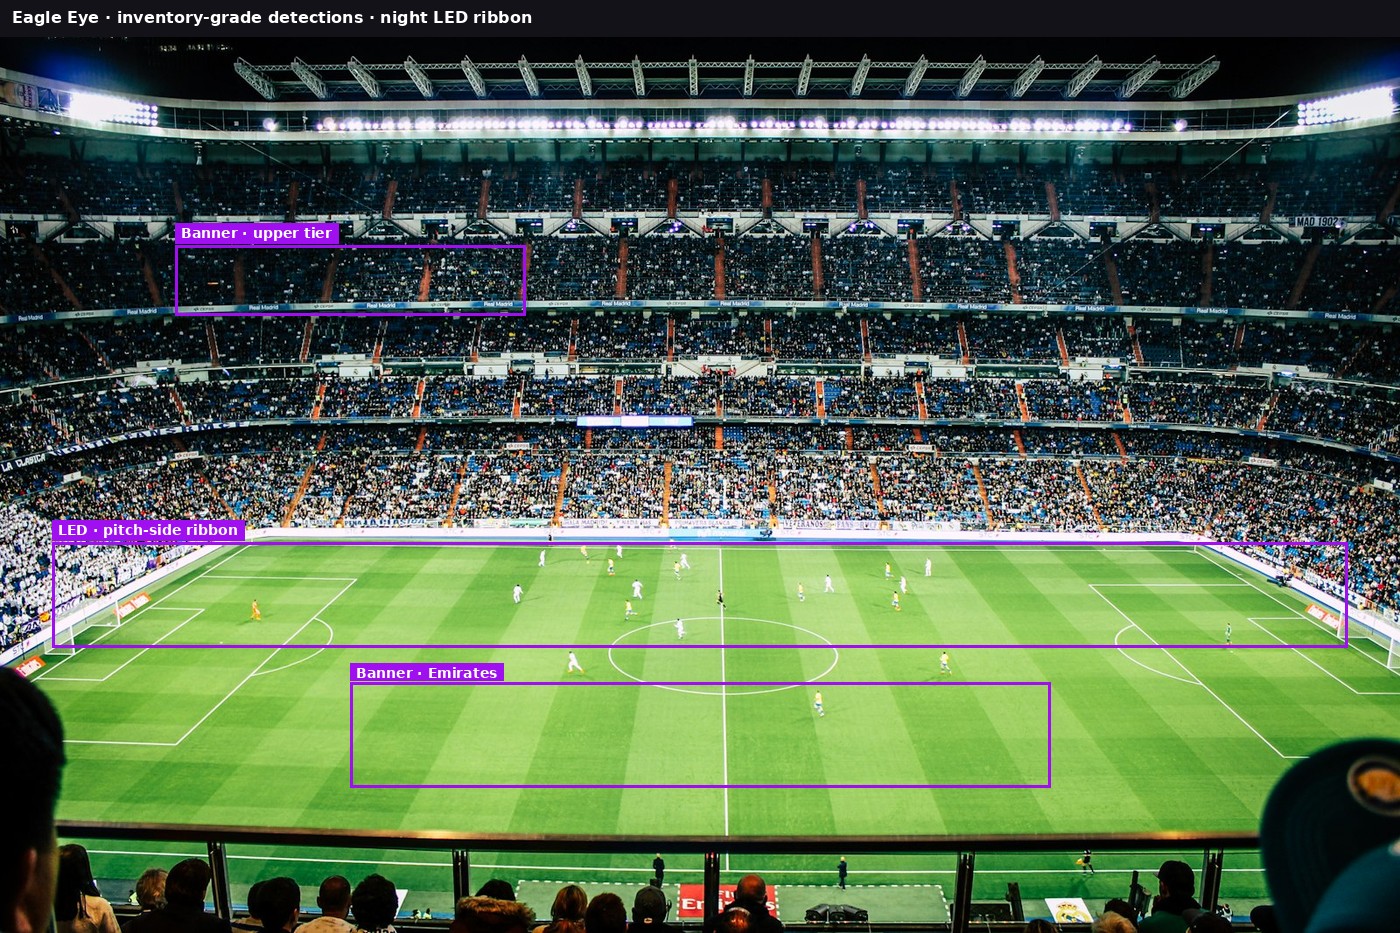
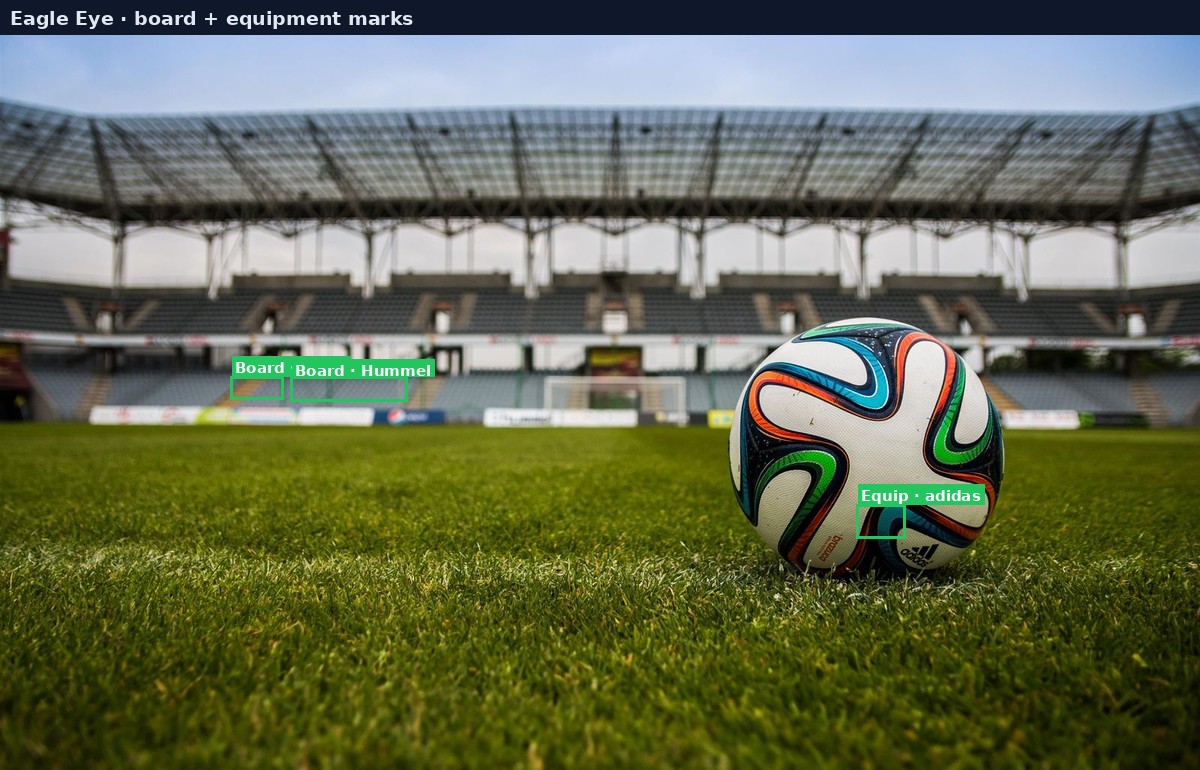
Real-world football inventory classes
- Touchline LED ribbons during open play and set pieces under main-camera and high-behind angles.
- Digital boards behind goal that appear only on goal-line and tight-goal cuts.
- Temporary tunnel and technical-area branding during half-time packages.
- Substitution board marks captured in close-ups that still carry contracted inventory.
- Upper-tier fascia banners that spike on wide establishing shots and crowd packages.
Across these scenes the same brand can appear on rotating LED creatives and static boards within one half. Sponsorlytix keeps those exposures distinct yet brand-attributed so partners see inventory fulfilment by asset class — the language contracts already use.
Results discussion (illustrative)
Relative exposure concentration typically clusters around the main-camera LED ribbon during open play, with secondary spikes when goal cameras frame digital boards. The chart below is illustrative of that inventory mix pattern. It is not a production KPI table.
Exposure schema and scoring code
Every detection that survives tracking writes a typed exposure event. The schema below is production-adjacent: it mirrors how Brand Detection and Placement Detection hand off to analytics factors and contract reconciliation.
from dataclasses import dataclass
from typing import Literal

AssetClass = Literal["led_ribbon", "digital_board", "tunnel", "banner", "other"]

@dataclass
class FootballExposure:
    brand_id: str
    asset: AssetClass
    camera_role: str
    bbox: tuple[float, float, float, float]  # xyxy normalised
    dwell_sec: float
    position: float   # analytics factor
    clarity: float
    visibility: float
    size: float
    viewership: float | None = None

def score_led_exposure(track, frame_meta) -> FootballExposure:
    """Illustrative visibility score for a tracked LED brand."""
    area = track.bbox.area / frame_meta.frame_area
    sharpness = track.laplacian_var
    occlusion = 1.0 - track.occluded_ratio
    visibility = area * sharpness * occlusion
    return FootballExposure(
        brand_id=track.brand_id,
        asset=track.asset_class,
        camera_role=frame_meta.camera_role,
        bbox=track.bbox.xyxy,
        dwell_sec=track.duration_sec,
        position=track.centre_weight,
        clarity=sharpness,
        visibility=visibility,
        size=area,
        viewership=frame_meta.estimated_audience,
    )
type PlacementEvent = {
brandId: string;
assetClass: "led_ribbon" | "digital_board" | "tunnel" | "banner";
factors: {
position: number;
time: number;
clarity: number;
visibility: number;
size: number;
viewership?: number;
};
};
function qualityIndex(e: PlacementEvent): number {
const f = e.factors;
return f.position * f.clarity * f.visibility * f.size * f.time;
}Takeaways
Pitch-side LED and digital board measurement succeeds when detection, tracking, and brand attribution stay coupled to the broadcast timeline. Sponsorlytix delivers that stack for football so rights holders and brands work from the same exposure ledger.
Eagle Eye keeps the methodology production-ready: segment the surface, track the creative, attribute the brand, score what the audience actually saw, and escalate ambiguity through HITL — with Turtul extending VLM escalation as it arrives.